PDF · 9 pages · Sweden, Norway, Denmark, Finland · January 2025 to August 2026
of clicks arrive within 12 hours of publishing
50%
arrive on day one
65%
click rate on Instagram story links, about 6× the feed
1.33%
more clicks on Monday than on Saturday
2.2×
What we found
Clicks come early, and on a schedule
Creator campaigns usually get judged on reach. This report looks at the moment people act: every tracked click on Beatly campaign links in the Nordics since January 2025, each with an exact timestamp. The window is short, and predictable enough to plan around. Here are three of the findings; the full report has the tables, the method and a launch checklist.
01
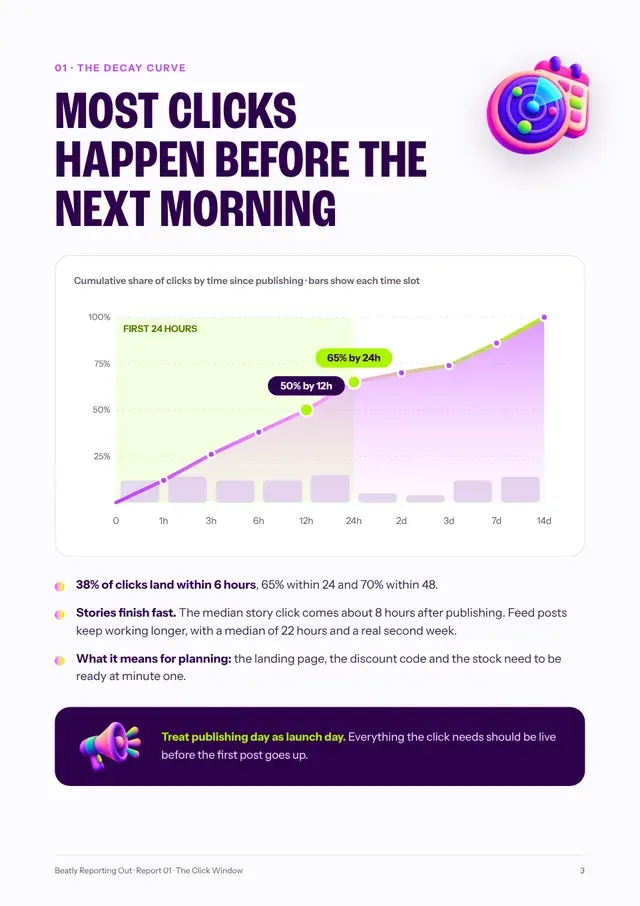
Most clicks happen before the next morning
38% of clicks land within 6 hours, 65% within 24 and 70% within 48. Stories finish fast: the median story click comes about 8 hours after publishing. Feed posts keep working longer, with a median of 22 hours. The landing page, the discount code and the stock need to be ready at minute one.
Cumulative share of clicks by time since publishing
Within 6 hours38%
Within 12 hours50%
Within 24 hours65%
Within 48 hours70%
Half of all clicks by 12 hours. Two thirds on day one.
02
Reach and clicks are different jobs
Instagram story links get a 1.33% click rate, six times the feed (0.22%). TikTok videos come in at 0.10%. Feed posts and TikTok travel further per follower, so the formats work best together: one builds attention, the story with the link collects the clicks.
Link clicks per 1,000 impressions · one cursor = one click
Instagram story≈ 13 per 1,000 1.33% click rate
Instagram feed≈ 2 per 1,000 0.22% click rate
TikTok video≈ 1 per 1,000 0.10% click rate
03
The evening window and the Monday click
Clicks peak at 18:00 CET, and 17:00 to 20:00 brings almost a third of the day’s clicks. Monday is the biggest click day of the week, 2.2× Saturday and ahead of Sunday.
Clicks by day of week · all 119,236 clicks
23.0kMon
18.3kTue
15.2kWed
16.5kThu
16.0kFri
10.5kSat
19.8kSun
Inside the full report
Nine pages you can plan with
The full decay curveFrom the first click to week two
Format and timing tablesClicks, impressions and click rate for stories, feed and TikTok
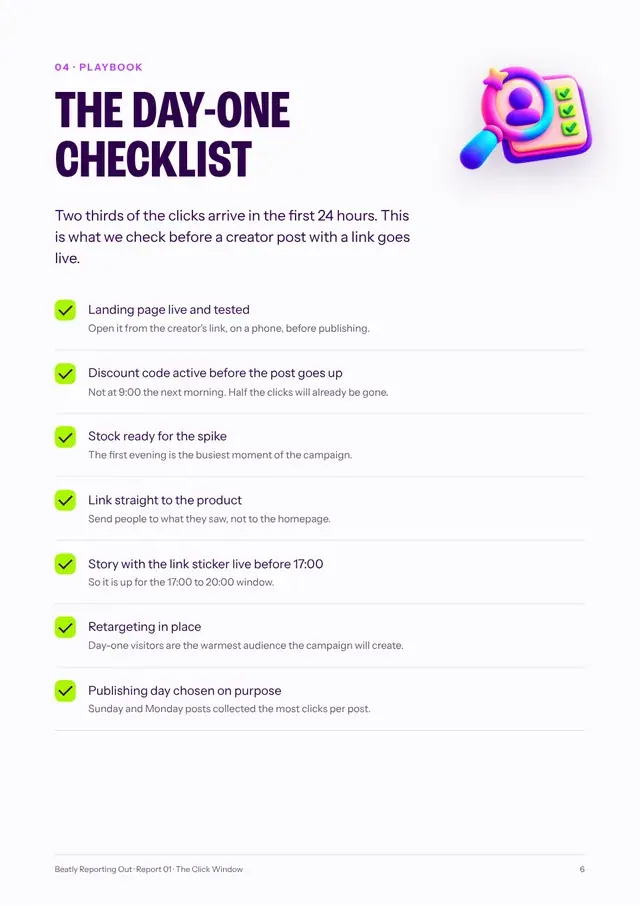
The day-one checklistSeven things to have live before a creator post goes up
Measuring the whole campaignWhy every tracked link counts, not only the post
The methodologyWhere the data comes from and how to read the findings
119,236 clicks on Beatly-tracked campaign links, January 2025 to August 2026, each with an exact server timestamp (CET). 50,838 clicks were attributed to a specific publication. Decay, format and click-rate figures use this attributed set; hour and day patterns use all clicks. Markets: Sweden, Norway, Denmark and Finland. All data is aggregated and anonymised; no client, campaign or creator is identified. The PDF ends with a full methodology page.
Questions
Before you download
Is the report free?
Yes. It is a 9-page PDF you can keep and share inside your team.
Where does the data come from?
119,236 clicks on Beatly-tracked links from creator campaigns in Sweden, Norway, Denmark and Finland, January 2025 to August 2026, each with an exact timestamp.
Are any brands or creators named?
No. Everything is aggregated and anonymised. No client, campaign or creator is identified.
Can I get these numbers for my own campaigns?
Yes. Beatly benchmarks the campaigns it runs against this dataset. Talk to a strategist about your next campaign.
 01